For logging to work:
1. $wgWMEStatsdBaseUri needs to point to a valid statsv endpoint,
   e.g. 'https://en.wikipedia.org/beacon/statsv'.
2. $wgPopupsStatsvSamplingRate needs to be set. Note that the codebase
   already contains the EventLogging functionality, which is configured
   separately. Separately configuring different logging mechanisms
   allows us to avoid sampling mistakes that may arise while choosing
   one or the other. For example, let's say we want to use EventLogging for
   10% of users and statsv for 5%. We'd sample all users into two
   buckets: 50/50. And then we'd have to set the sampling rates as
   20% and 10% respectively, only because of the bucketing above. To avoid
   this kind of complications, separate sampling rates are used for each
   logging mechanism. This, of course, may result in situations where a
   session is logged via both EventLogging and statsv.
3. The WikimediaEvents extension needs to be installed. The extension
   adds the `ext.wikimediaEvents` module to the output page. The
   logging functionality is delegated to this module.

Notable changes:
* The FETCH_START and FETCH_END actions are converted to a timed action.
* The experiments stub used in tests has been extracted to the stubs
  file.

Logged data is visualized at
https://grafana.wikimedia.org/dashboard/db/reading-web-page-previews

Bug: T157111
Change-Id: If3f1a06f1f623e8e625b6c30a48b7f5aa9de24db
2.8 KiB
Instrumentation
Page Previews is thoroughly instrumented. Currently, there's one Event Logging ("EL") schema that captures all of the data that we record about a user's interactions with the Page Previews extension, the Schema:Popups schema. There is also a statsv instrumentation, which is visualized as a Graphana dashboard. The primary purpose of the statsv instrumentation is to monitor the performance of PagePreviews in production.
Tilman Bayer captured the high level state and user action's that should trigger an event to be logged via EL here – indeed, this diagram was a catalyst for rewriting the Page Previews application as a large finite state machine.
Implementation
EventLogging
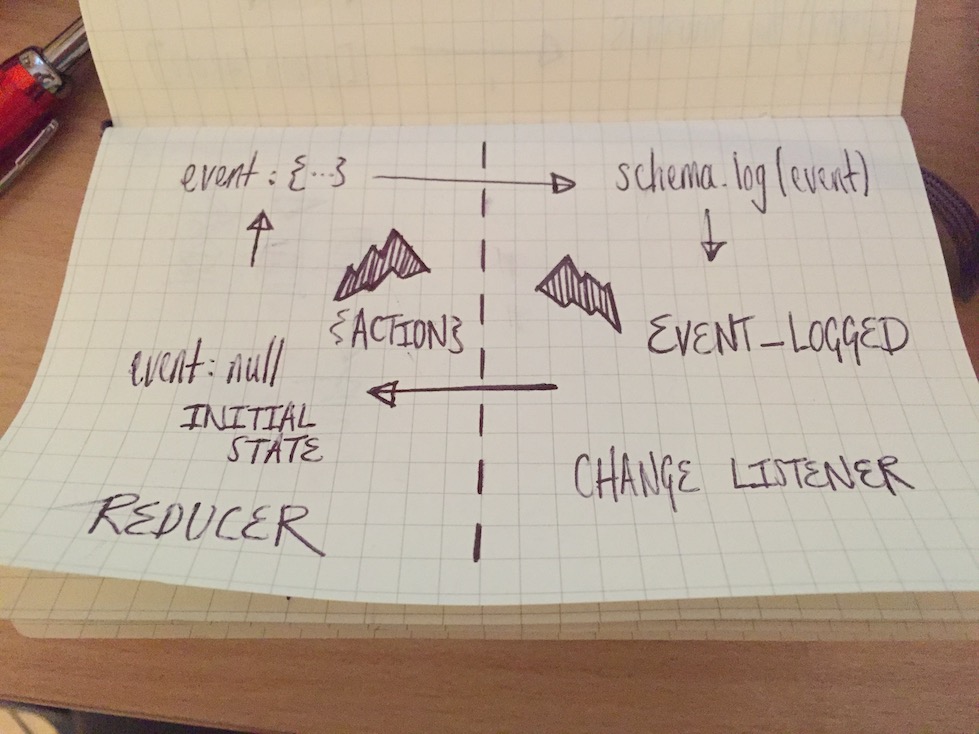
Events need to be queued and dequeued in response to actions dispatched to the store. This could be implemented in either a Redux middleware or as a reducer, an action, and a change listener. Both approaches satisfy the general requirement that instrumentation should be transparent to the rest of the codebase but the latter is the approach we're taking for the rest of the application and instrumentation isn't a special case. Moreover, given the amount of time it took to get the original instrumentation under test, we can leverage the constraint the reducers must be pure to test the majority of the instrumentation logic in isolation.
Since the event data varies with the value of the action property, events are represented by a blob of action-specific data and a blob of data that's shared between all events. Very nearly all of the latter can and should be initialized when the Page Previews application boots.
Data Flow
When enqueuing and logging an event, data flows between the reducer and the change listener as follows:
- The state is initialized to
null.. - An event is enqueued by the reducer as a result of an action.
- The change listener sees that the state tree has changed and logs the queued event via
mw.eventLog.Schema#log. - The change listener dispatches the
EVENT_LOGGEDaction. - The reducer resets the state (read:
GOTO 1).
Statsv
Statsv instrumentation works similar to the EventLogging instrumentation, but it logs fewer pieces of data.
